Prometheus
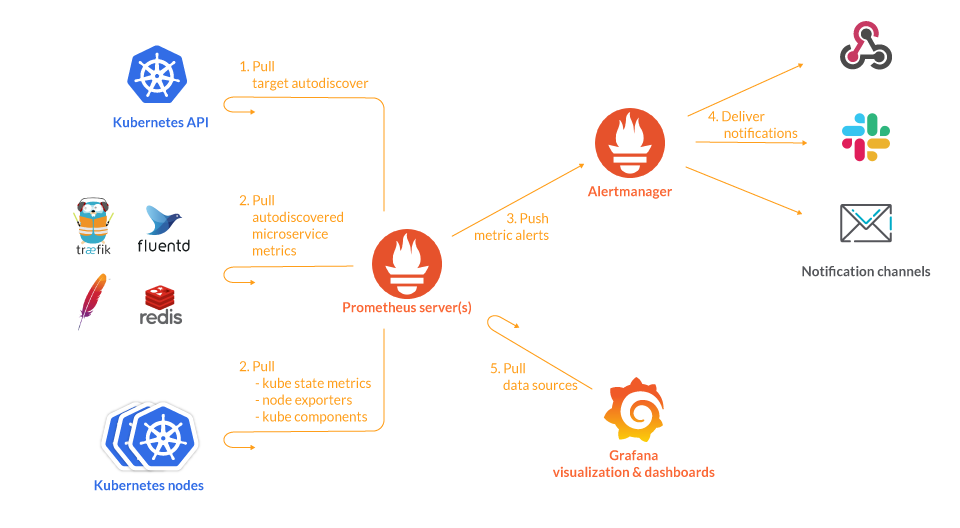
Prometheus is Power your metrics and alerting with the leading open-source monitoring solution., used for Full Monitoring . An open-source monitoring system with a dimensional data model, flexible query language, efficient time series database and modern alerting approach.
Prepare
When referring to this document to use Prometheus, please read and ensure the following points:
-
Login to Websoft9 Console and find or install Prometheus:
- Go to My Apps listing applications
- Go to App Store installing target application
-
This application is installed by Websoft9 console.
-
The purpose of this application complies with the apache2 open source license agreement.
-
Configure the domain name or server security group opens external network ports for application access.
Getting Started
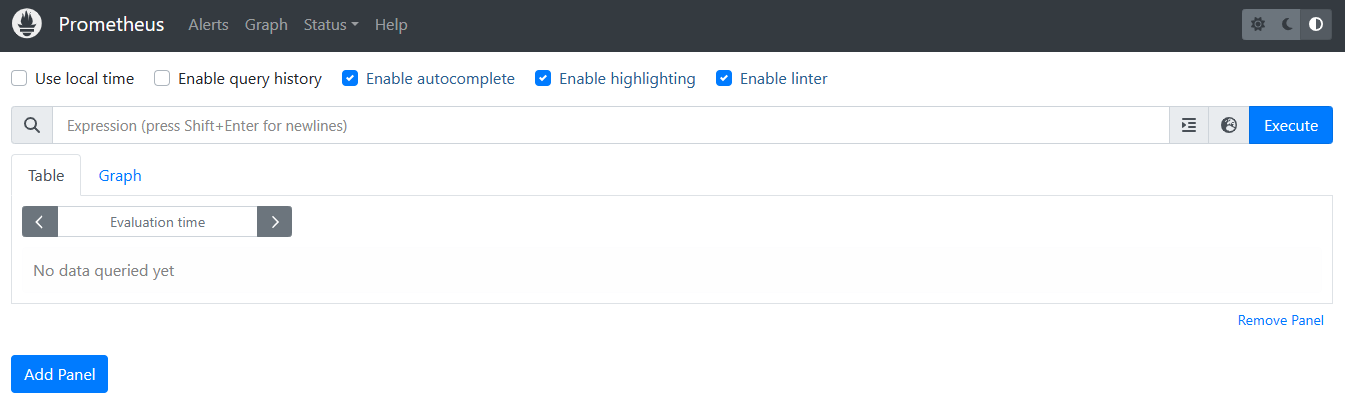
Login Verification
-
After completing the installation of Prometheus in the Websoft9 Console, retrieve the application's overview and access details from My Apps.
-
Prometheus can be accessed without authentication by default.
-
(Optional) If you want to control access, you can configure it through the Websoft9 Gateway.
Integrating Grafana
Grafana is a powerful visualization tool for Prometheus. For detailed instructions, refer to: Grafana Support for Prometheus.
Configuration Options
- Configuration file location (mounted to the server):
/etc/prometheus/prometheus.yml - Data collection methods:
- Pull: Directly pull data from the datasource.
- Push: Use Pushgateway to receive pushed data.
- Basic Authentication
- Connecting Alertmanager and Pushgateway: Requires adding configuration files to establish the connection.